Building a Spatial Web App - Part 1
In order to experiment with the new, supported spatial/multi-dimensional querying and indexing features in Couchbase 4.0 as well as teach myself some new AngularJS tricks, I decided to build a web app which would require a spatial index.
I chose to use the CEAN stack (Couchbase, Express, Node.JS and AngularJS) since I wanted to play around with an all JSON and JavaScript app. Couchbase Server fits brilliantly with an asynchronous, event driven paradigm but my front-end design ability is mediocre at best so I decided to jump in at the deep end... actually, with the documentation and community around all of the elements in the CEAN stack it is rather an easy learning experience!
In this introductory blog, I'm going to introduce the dataset I chose and the application functional requirements.
Choosing a Dataset
I wanted data that could be easily understood by anyone. Given that I am British and we are notorious for complaining about the weather, that was my first port of call!

In the end I discovered the amazing NOAA ISH/ISD dataset. The NOAA is the US National Oceanic and Atmospheric Administration. The dataset includes samples of weather (temp/pressure/wind speed/etc.) for the entire planet in at least hourly intervals.
You can see some more information on this data in the next instalment.
Specifying the Application Functional Requirements
Once I had decided on the dataset it was time to identify what I wanted to implement in my application. Couchbase has multiple customers in the insurance industry and personal friend works as an underwriter on ship-hulls. I decided that it would be nice for her to able to quickly check whether a claim for a lost ship was legitimate. So, here's the scenario:
A claim arrives at the insurance desk for a large ship. The owner claims that the ship has been sunk at {COORDINATES} on {DATE} and at {TIME} due to a raging storm. The underwriter needs verify:
- Is the claim is legitimate? I.e. Did the weather at that time match the stated conditions?
- Does the pricing of the risk need to be reassessed in that area based on historic and current climactic conditions?
So, if I translate the high level requirements into a bit of a user story:
- The user should able to search for the weather at a particular location, at a particular date and time.
- The user should be able to easily retrieve historic data for the location.
- The user should be able to find all monitoring stations within a specific distance of the 'target' location.
- The user should be able to view the information in a human-understandable manner (i.e. graphically and tabular).
- The user should be able to access the data via a modern web browser.
- The user should experience a familiar interface with minimal learning curve.
That's probably enough for us to get an idea of where I'm going with this.
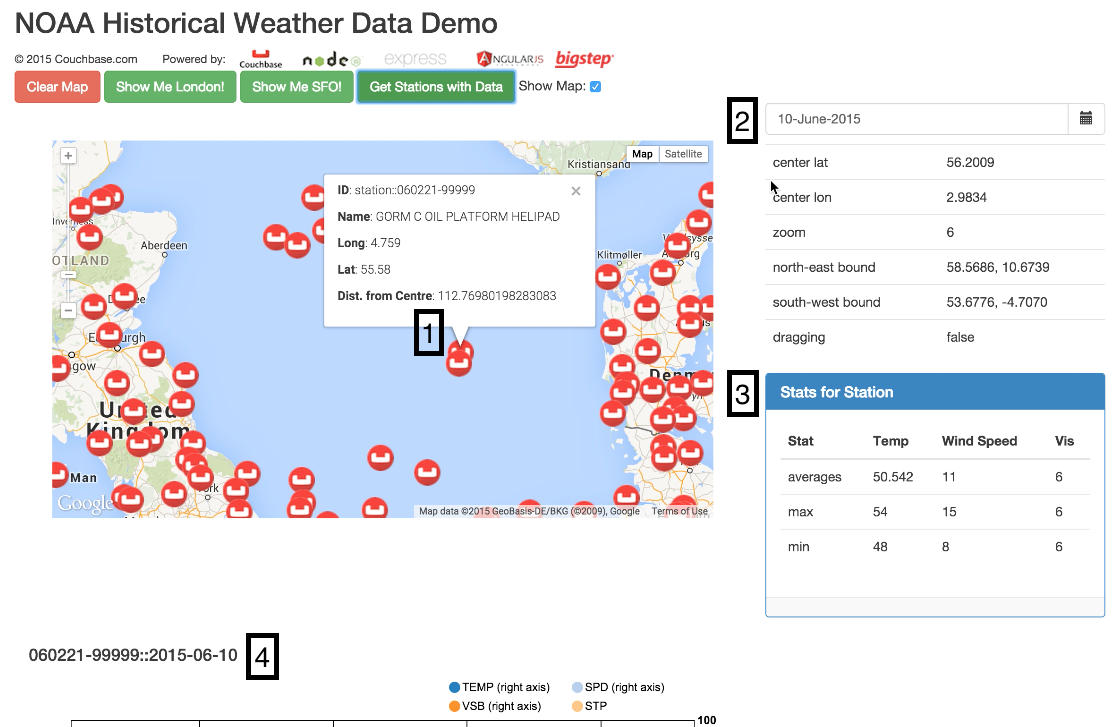
In the next few blogs in this series, I will explore the process of actually building this application. In the meantime, here's a teaser of the first version of the interface.
For the next instalment, click anywhere here!.